Formal classification
Four basic classification scales of measurement variables are commonly
used
in market research [Stevens, 1951].
- Nominal scaled
Every value is a code for a numerically incomparable entity, such as
outlet, make, brand or color. The values have no natural order and
allow no mathematical operations.
- Ordinal scaled
A value gives a ranking of the item, e.g. version or grade of a
product, top-speed, loading capacity, etc. There is no distance defined
between the scale points.
Some values may be
skipped
and not used as levels, e.g. when a too "dense" scale needs to be
simplified.
An interval-based variant of the scale is often obtained from a
quantitative variable, often when its distribution is unknown. An
advantage is truncation of the distribution tails, e.g. for the stated
income level. .
- Interval scaled
The difference between consecutive values is equal, but the
base or reference point, i.e. the zero value, is arbitrary and/or set
by a convention.
The values
can be shifted (a constant added), counted up, multiplied by a constant
(re-scaled) but not multiplied mutually. An example may be
temperature that can be given in Celsius, Fahrenheit, Kelvin or Rheomir
degrees.
- Ratio scaled
Values can be either integers, e.g. number of pieces,
or decimal values. The most distinct property is existence of a
non-arbitrary, uniquely defined zero representing the absence of the
object or value.
| Type of variable scaling |
Values can be rank-ordered |
Values can be separated by equal interval |
Non arbitrary zero |
| Nominal |
- |
- |
- |
| Ordinal |
X |
- |
- |
| Interval |
X |
X |
- |
| Ratio |
X |
X |
X |
Variables with higher level of measurement scaling can always be
transformed (or recoded) to a lower level of measurement scaling. This
is often the case when distribution of the original quantity is
strongly asymmetric or heavy tailed which excludes use of methods that
assume normal or any other "well behaved" distribution of random
variables. This is especially true for most of linear methods of
classical statistics. E.g., family income is often recoded into ordinal
categories based on census. More or less heuristic Likert scales are
often used to get rid of heavy tails.
Behavioral classification
- On the real market, purchasers seldom make optimal choices. A
choice of goods is often a compromise. It is believed that the
most efficient way for a consumer to accomplish a purchase is a
"satisficing", i.e. choosing the first item that is
- sufficient and
- fairly satisfying.
If none of the above conditions is met the purchase will not proceed.
In
CBC - Choice Based Conjoint, this
situation is simulated by a choice of a constant alternative, mostly a
"none of these" one.
 As aside
- Satisficing is due to incomplete knowledge or awareness,
inactivity, or lack of time or expectation on the side of the
purchaser, or poor accessibility of an optimal product at the time of
the actual purchase. However, indirect utility of the chosen product
is often
close to that of an optimal product. This should be respected in what-if
simulation
and its interpretation.
- Satisficing is closely bound to affordability. An
attractive product that has high "felicity"
but is not
affordable has
low preference, and, therefore, low indirect utility and choice
probability. It is this probability we are interested in.
- A possible analytic approach to satisficing is estimation of the
calibrated product acceptance
and the competitive potential derived from it, especially in combination
with a behavioral segmentation
of the target.
An interval or ratio scaled market variable can, and in most cases
does, contribute to satisfaction with a product in a monotonic way.
However, the increment is seldom directly proportional to the change of
the marketing variable. Utility dependence on a quantity (or a quality
given by a
value) of a benefit can be of four basic types:
-
- Must-haves, typically with concave dependence.
- Delighters (latent needs) , typically with convex
dependence.
- Linear satisfiers, i.e. with linear dependence on
the [possibly transformed] value.
- Neutrals have no or undetectable influence.
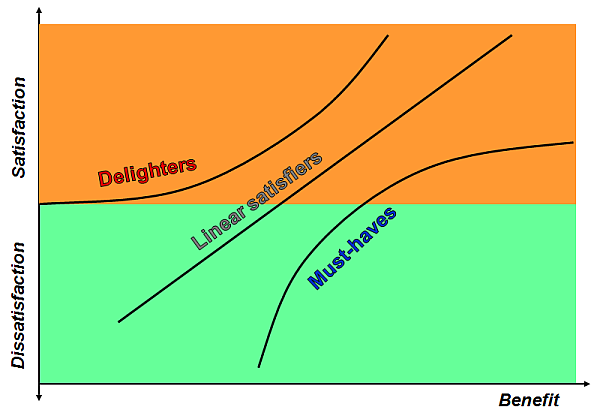
As aside
- The picture is a simplification of Kano diagram used in Quality
Function Deployment.
- An analogous reasoning
can be used for detriments (inverted benefits), e.g. for price
attributes (fees, charges, rates, tariffs,
etc.).
- Any monotonic transformation of a utility is a utility on a
different interval scale. A monotonic transformation of a
quantitative
benefit attribute is often useful to obtain a "linear satisfier".
This
is often possible with price attributes under certain conditions.

