

MXD - Maximum Difference Scaling
A common task in MR is to quantitatively assess perceptions of aspects concerning entities such as brands, features, packaging, options, availability or affordability in terms of preference, importance, likes or dislikes. This is usually done by offering the items to a respondent by random with the answer to be selected from a scale. It is well known that, irrespective of the scale, the answers are often accumulated to one side of the scale with many ties and thus low discrimination between answers.
When the number of items is small, sorting of items can be used but the problem of transformation of the ranks to preference quantities arises. With a number of items exceeding some value (about 12 or more) the sorting may fail. Respondents feel lost in the maze of items and simply resign from doing the task properly.
A choice based solution known as MXD - Maximum Difference Scaling method (often shortened to MaxDiff) was originally developed by Jordan Louviere. The current format can be considered as a generalization of the pair-wise comparison method. Respondent is presented with a randomized choice set of a relatively low number of offers, usually 3 to 6, and selects the two that best and worst fit the asked question. To obtain sufficient data equivalent to a full ranking of the items, choices from quite a high number of choice sets would be needed. The number of choice-sets can be decreased using an empirical Bayes estimation with priors obtained from population means.
A summary of the method and its use can be found in the published conference paper. The estimation method is described on Sawtooth MaxDiff pages. Use of the Sawtooth implementation of MXD is growing rapidly as can be seen in the picture below.
The usage increased to 68% in 2015.
By our best knowledge, and in agreement with views of others, MXD surpasses any other method for comparison and quantitative evaluation of fixed item preferences, and has become de facto an industry standard. The recommended number of items is about 12 to 30, but the method has been successfully applied for 45 items with a good reliability. A nesting of items into more or less homogeneous groups is possible which allows estimation of influences for separate groups of items.
 As aside
In many problems encountered in MR the actual interest is in the most influential items. The original method can be simplified by omitting the choice of the least desirable item which substantially decreases the interviewing time. Though the precision of estimated part-worth for the "worst" items is grossly impaired (cf. DCM Approach Basics) this is of no problem if there is little interest in their interpretation. A live demo of a questionnaire is available.
The items of interest are often required to be viewed from several perceptional aspects leading to different types of preference as is common in medicinal, pharmaceutical, financial, insurance, telecommunication and other topics. A lot of interviewing time can be saved by grouping different types of preference choices in a grid (see live demo). Each type of preference is evaluated as a separate MXD exercise.
As with all DCM-based methods, interpretation of an analysis depends on the format of the representative values. Influences are computed formally as preference shares. The information on action probabilities (purchase, switch, churn, etc.), conditional on or induced by the tested items, can be obtained from an additional block of calibration questions, usually asked for several of the most often chosen items. The stated acceptances can be computed from the calibrated part-worths. Typical is their use in estimation of competitive potential of the offers. Calibration procedure is a more advanced replacement for the more common anchoring that is simpler but requires longer time to interview and is less efficient.
Strengths
Weaknesses
A telecommunication company had an intention to attract new users to their Internet services by offering some invitation benefits. The goal of the research was to find the most efficient benefit. The results from a MaxDiff task answered by 351 respondents are summarized in the pictures below. The benefits and their descriptions have been truncated and/or changed for apparent reasons.
[ Note: If you do not see the pictures above side by side please make the browser window wider. ]
As part-worths have not been calibrated by purchase intention conditional to the benefit, they are centered and named "raw". Influence of an item for an individual is the item preference share provided all tested items are present in the simulation set. Influences of all tested items therefore sum to 100 % and provide no information on the probability of the intended or expected action. Average influences exhibit order reversals compared to average raw part-worths. The suggested presence of behaviorally different segments in the sample has been confirmed by LCA - Latent Class Analysis. The most influential subsets of the items are shown in an example on page DCM Portfolio Optimization.
MXD is a self-contained method that usually ends with relative influences of the items for the total sample or predefined segments. In some cases, the items can be described by attributes and their levels. A pseudo-conjoint analysis of the choices can give a more comprehensive view of the problem. This was the case of a set of 64 rewards for charging a telecommunication service. Each reward was dependent on the charge. For the purpose of an additional analysis, each item has been assigned a level of a charge amount attribute with 4 levels (200, 400, 600 and 800 Kč), and a level of reward type attribute with 16 levels. The number of computed part-worths decreased from 64 in MXD to 20 in this analysis. The results are presented in a two-dimensional MDS - Multi-Dimensional Scaling space so that associations among the attribute levels are revealed.
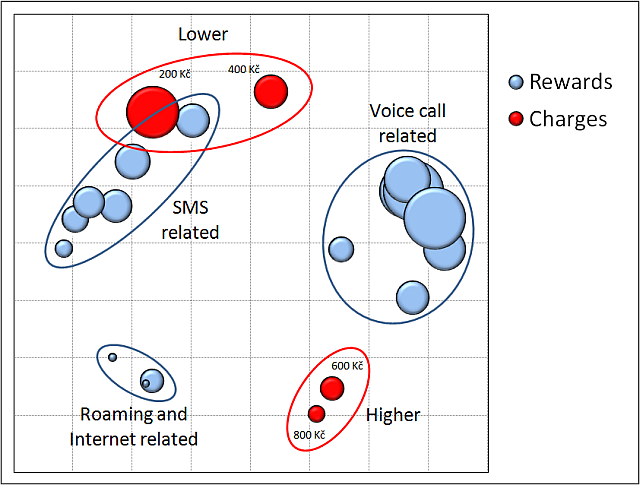
The space in MDS has no intrinsic orientation or axes. Only distances between points are meaningful. The closer to each other any two points are the more similar perception they represent. The size of bubbles corresponds to influences of the attribute levels as obtained from the pseudo-conjoint analysis. In accordance to LCA, users can be classified as low and high spenders, and callers and SMS users. There is only a minority of other services users. As this depiction could have been expected as apparent it provides the proof of MXD and MDS being robust and reliable research and analytic methods.