

DCM Portfolio Optimization
A bank ... sent out 60,000 letters to existing clients saying "Congratulations! You're eligible for a special interest rate on a new loan." Like a drug trial, the interest rate was randomized. In line with traditional economics, the people who received the high interest rate were less likely to take up the offer.
But the bank also randomized other aspects. For some letters, a photo of a bank employee, ..., a variety of tables, some complex and others simple, ..., deadlines, ..., and the chance to win prizes.
The results were stunning. People appeared to be influenced by factors other than the actual interest rate. ... The letter with just one example of a loan size and term with its monthly repayments was more successful than the letter with four examples ...
[ From once a public source on http://www.med.govt.nz, shortened ]
A common task in marketing engineering is to set up a product portfolio or a line of products that maximize a desired criterion such as reach, choice frequency, acceptance value, competitive potential, etc. Confusion from a too large selection of products has been named "tyranny of choice". It often makes a potential customer postpone the purchase, especially in the category of durables requiring high involvement. A too narrow portfolio, on the other hand, may discourage some customers as little representative. In FMCG category it is important to offer a sufficiently broad spectrum of products to satisfy individual desires and needs but, at the same time, to keep the production and distribution costs low. Clearly, finding a optimal portfolio composition is a frequent research tasks.
A method known as TURF - Total Unduplicated Reach and Frequency is often used. It allows to find a set of items that manifest a satisfactory reach by allowing a sufficient diversity of choices for potential users. The method suffers from two major deficiencies.
The last property is very inconvenient in product line pruning, an efficient method for decreasing production and logistics cost, as TURF characteristics can only stay the same or decrease when an item is removed from the set.
A process of making choice from a set of several items can be viewed quantitatively from the standpoint of the following DCM characteristics of the set.
 As aside
While utilities are not additive and should not be averaged across individuals, choice probabilities and consumption quantities are. Therefore, optimization of a set of items in respect to a sample should be be done by maximizing the portfolio acceptance, consumption or spend related to the expected or persuasive value across the individuals in the target. Acceptances can be computed from the standard logit formula.
Individual inclusive value is not very helpful in portfolio optimization as it always grows with an item added to the set. It is eligible only in the case when the number of items in the portfolio is known beforehand.
Individual expected value of a choice set is often only slightly lower than the value of the most preferred item in the set. Optimization by expected values for a sample usually leads to a relatively broad set tending to satisfy all important population segments with several products being chosen concurrently.
A portfolio of products perceived as too similar might make the products to cannibalize one on another. The strategy should be to make the portfolio narrower but possibly not too much because of psychological reasons. This may be achieved by introduction of controlled dose of choice "confusion", i.e. information entropy. In the case of low choice probabilities (and sales), one might "give a chance" to a higher number of apparently different products.
Low involvement FMCG/CPG consumer goods are the candidates for optimization of a portfolio by its expected value.
In contrast, optimization by aggregated acceptance derived from individual persuasive values gives a substantially narrower portfolio. The unaccepted items are understand as simply ignored by the individual and do not influence persuasive value of the set. In contrast, multiple items with acceptances close to the most accepted item decrease the persuasive value of the set for an individual by the increased information entropy equivalent to the doubt which of the offered items to chose. If the products are of the same brand a substantial decrease of cannibalization may be achieved.
Durables or other infrequently purchased products with many decisive aspects requiring high involvement of the decision maker, or consumer goods purchased infrequently or occasionally in small quantities, are the candidates for the optimization by persuasive value of the portfolio.
Intuitively, the "best" choice set for an individual to make a fast and unequivocal decision would be just a single electable product. People often listen to a recommendation of an (assumed) expert who actually offers just a single choice being aware of the fact that any other extension of the choice set would raise doubts. It has been found experimentally that the number of products in the optimal set considered by an individual rarely exceeds 3 or 4 products. As preferences of individuals differ, the marketed set must be broader to satisfy expectations of the target but not so broad that it would markedly increase confusion in individual consumers.
There are two fundamental approaches in application of the portfolio optimization method.
Estimation of the optimal choice set can take account of some known factors used as weights. Total consumption quantities are often used for concurrently purchased products. When the candidate products have final price tags the method can be enhanced to an optimization based on maximization of estimated total revenues. An appropriate interviewing format (e.g. SCE – Sequential Choice Exercise or CBC - Choice Based Conjoint) and sufficiently representative sample are essential.
Referring to the demonstrative example of car preferences in the two person target discussed in the chapter on what-if simulations it is intuitively clear that the car provider should offer German and French cars for the given target. For the 3 items (cars by origin) there are 23 - 1 = 7 possible combinations. The choice characteristics averaged over the two potential buyers for the 7 portfolio combinations are in the following table.
As aside| Number of cars in portfolio |
Offered [ ● = yes, - = no ] |
Portfolio value over the target [logit units] |
||||
| Fra | Ger | Jap | Inclusive | Expected |
Persuasive |
|
| 1 | ● |
- |
- |
0.00 | 0.00 | 0.00 |
| - | ● |
- |
0.00 | 0.00 | 0.00 | |
| - | - | ● |
2.00 | 2.00 | 2.0 | |
| 2 | ● |
● |
- | 4.00 | 4.00 | 3.99 |
| ● |
- | ● |
3.06 | 2.87 |
2.68 | |
| - | ● |
● |
3.06 | 2.87 | 2.68 | |
| 3 |
● |
● |
● |
4.13 |
3.76 |
3.39 |
The best values in the table are marked with light green background. For
a set with a single item, the confusion is none by definition, and the
inclusive, expected and persuasion values are the same. For sets with two
items, the set composed of German and French cars (shown in bold) is the
best. Confusion value (the difference between expected and persuasive
values) is very small as a person who prefers one of the cars is fully
uninterested in the other one and simply ignores it. While the inclusive
value of the set with all three cars is the best one, its persuasion value
is perceptibly lower than its expected value. This is because the
alternative of a Japanese car is included in the process of making
decision but is not going to be actually chosen by any individual from the
sample.
A telecommunication company had an intention to attract new users to
their Internet services by offering invitation benefits. The data come
from the example given on page MXD - Maximum Difference
Scaling. The goal was to find a small and efficient set of benefits
to offer. As the benefits were clearly low involvement ones, expected
value was used as the criterion. Results for sets with 2, 3 and 4 benefits
in decreasing order of expected acceptance (from top to bottom) are in the
table below. The best sets for fixed number of items are shown in light
green.
| Number of items |
Offered [ ● = yes ] | ||||
| Computer price discount | Anti-virus/spam support | Internet installation |
Print of photos |
Access to music site | |
| 4 |
● | ● | ● | ● | - |
| ● | ● | - | ● | ● | |
| 3 |
● | ● | - | ● | - |
| ● | ● | ● | - | - | |
| 2 |
● | ● | - | - | - |
| - | ● | - | ● | - | |
The best set set composed of 2 benefits contains the two items found as
best in MXD. However, replacing "Computer price discount" for "Print of
photos" makes the set only slightly worse and should be worth of
consideration. "Internet installation" enters the second-best set with 3
items. That, extended by "Print of photos" benefit makes the best set with
4 items.
| Comparing the benefit influences obtained from MXD
with the current findings shows the following. |
|
The producer of the First brand snacks was considering introduction of a
smaller packaging for a presumably significant segment of users. The
problem was to decide if an introduction of packages containing either 1
or 3 pieces (servings) of the snack would increase reach and/or share with
or without replacement of the current 4 piece packages. The major
competing brands Second and Third were available only in 4 piece packages.
Each competing brand was represented by 3 flavor varieties. A conjoint
brand-price study was run in a design equivalent to that in the class-based demo to
outweigh the disbalance in representation of the brands.
Prices of the products were set so that when price of a piece was 100% in a 4-piece package, the piece prices in 3-piece and single piece packages were 96% and 111 %, resp. The competitive acceptances derived from persuasive values of all 511 combinations (29–1) of the nine First brand products were computed and sorted from best to worst. The results for 3 item portfolios are shown in the picture below.

Evidently the best portfolio of 3 products with persuasive acceptance
0.4304 is composed of 3-piece packages. Adding the 4-piece packages, thus
making a portfolio of 6 products, would increase persuasive acceptance
only to 0.4372 and, therefore, would make no sense. This result is a rare
example of "one size fits all".
The improvement of the switch from the current portfolio of 4-piece to 3-piece packaging is demonstrated in the pictures of competitive potential below.


The top-box of competitive potential (product acceptance > 0.95) of the current 4-piece portfolio is quite low as only about 6% of the sample would "definitely" choose the First brand and 60% one of the other brands. The switch to 3-piece packaging of the First brand products should change these numbers to 26% and 29%, resp. The increase of average acceptance of the First brand from 0.20 to 0.46 suggests more than doubling the choices. Even with the price decreased to 72% for the 3-piece package the revenues might increase by about 40%.
A producer of energetic drinks asked to suggest portfolios of their products for some types of sales points. The market was represented with brands A, B, C, D and E with 6, 2, 3, 2 and 3 package and size varieties, resp. As prices were fixed, MXD - Maximum Difference Scaling was used as the test exercise. This example is concerned with modern trade only.
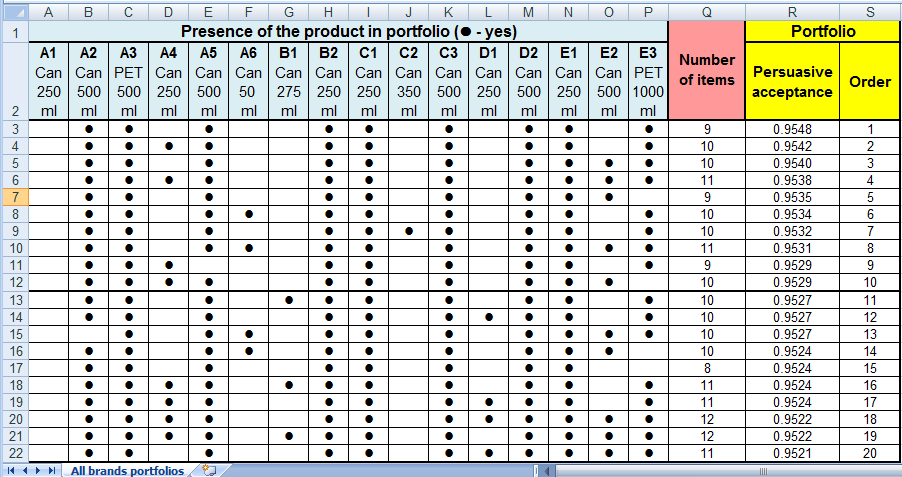
The results from the view of the brand A producer when all other brands are set as competing are shown in the picture below. Since research data are never without error it is always useful to look at several best portfolios. The first 10 of them are usually sufficient to form an opinion.

It is clear the products A2, A3 and A5 are the golden eggs with their presence in 9 of 10 best portfolios. The presence of the extra small package A6 (50 ml) is surprising as it was intended namely for other sales points such as filling stations or restaurants. The products A1 and A4 are partly interchangeable and of smaller size than expected to be sold in malls. The recommendation would be to keep all the 6 products in portfolio as they make the 5-th best portfolio and their number is not excessive.
The choice sets for a modern trade sales point that tends to minimize the portfolio size and still have a satisfactory offer for majority of customers are in the picture below.
The most persuasive portfolio is composed of 9
products from the total of 16 tested products. The 3 varieties of the
brand A mentioned above appear in nearly all successful portfolios for a
modern trade sales point. Adding the product A4 would make the second best
portfolio. Each of the other brands is represented by a lower number of
varieties. Namely the products A1, B1, C2 and D1 are losers in the
competitive environment and can be recommended for exclusion from a modern
trade portfolio.